July 25, 2021 - I was thinking about interesting ways to represent hierarchical information like geneological data or typographical features in language families, so I started looking up different kinds of fractals, and I came across Pythagoras tree fractals. This is how you build a simple (symmetric, binary-branching) Pythagoras tree:
I thought this looked really cool, but from that animation you can see a problem with using them to depict information: at the fifth step, the branches start to overlap with one another, and some of the squares are hidden from view.
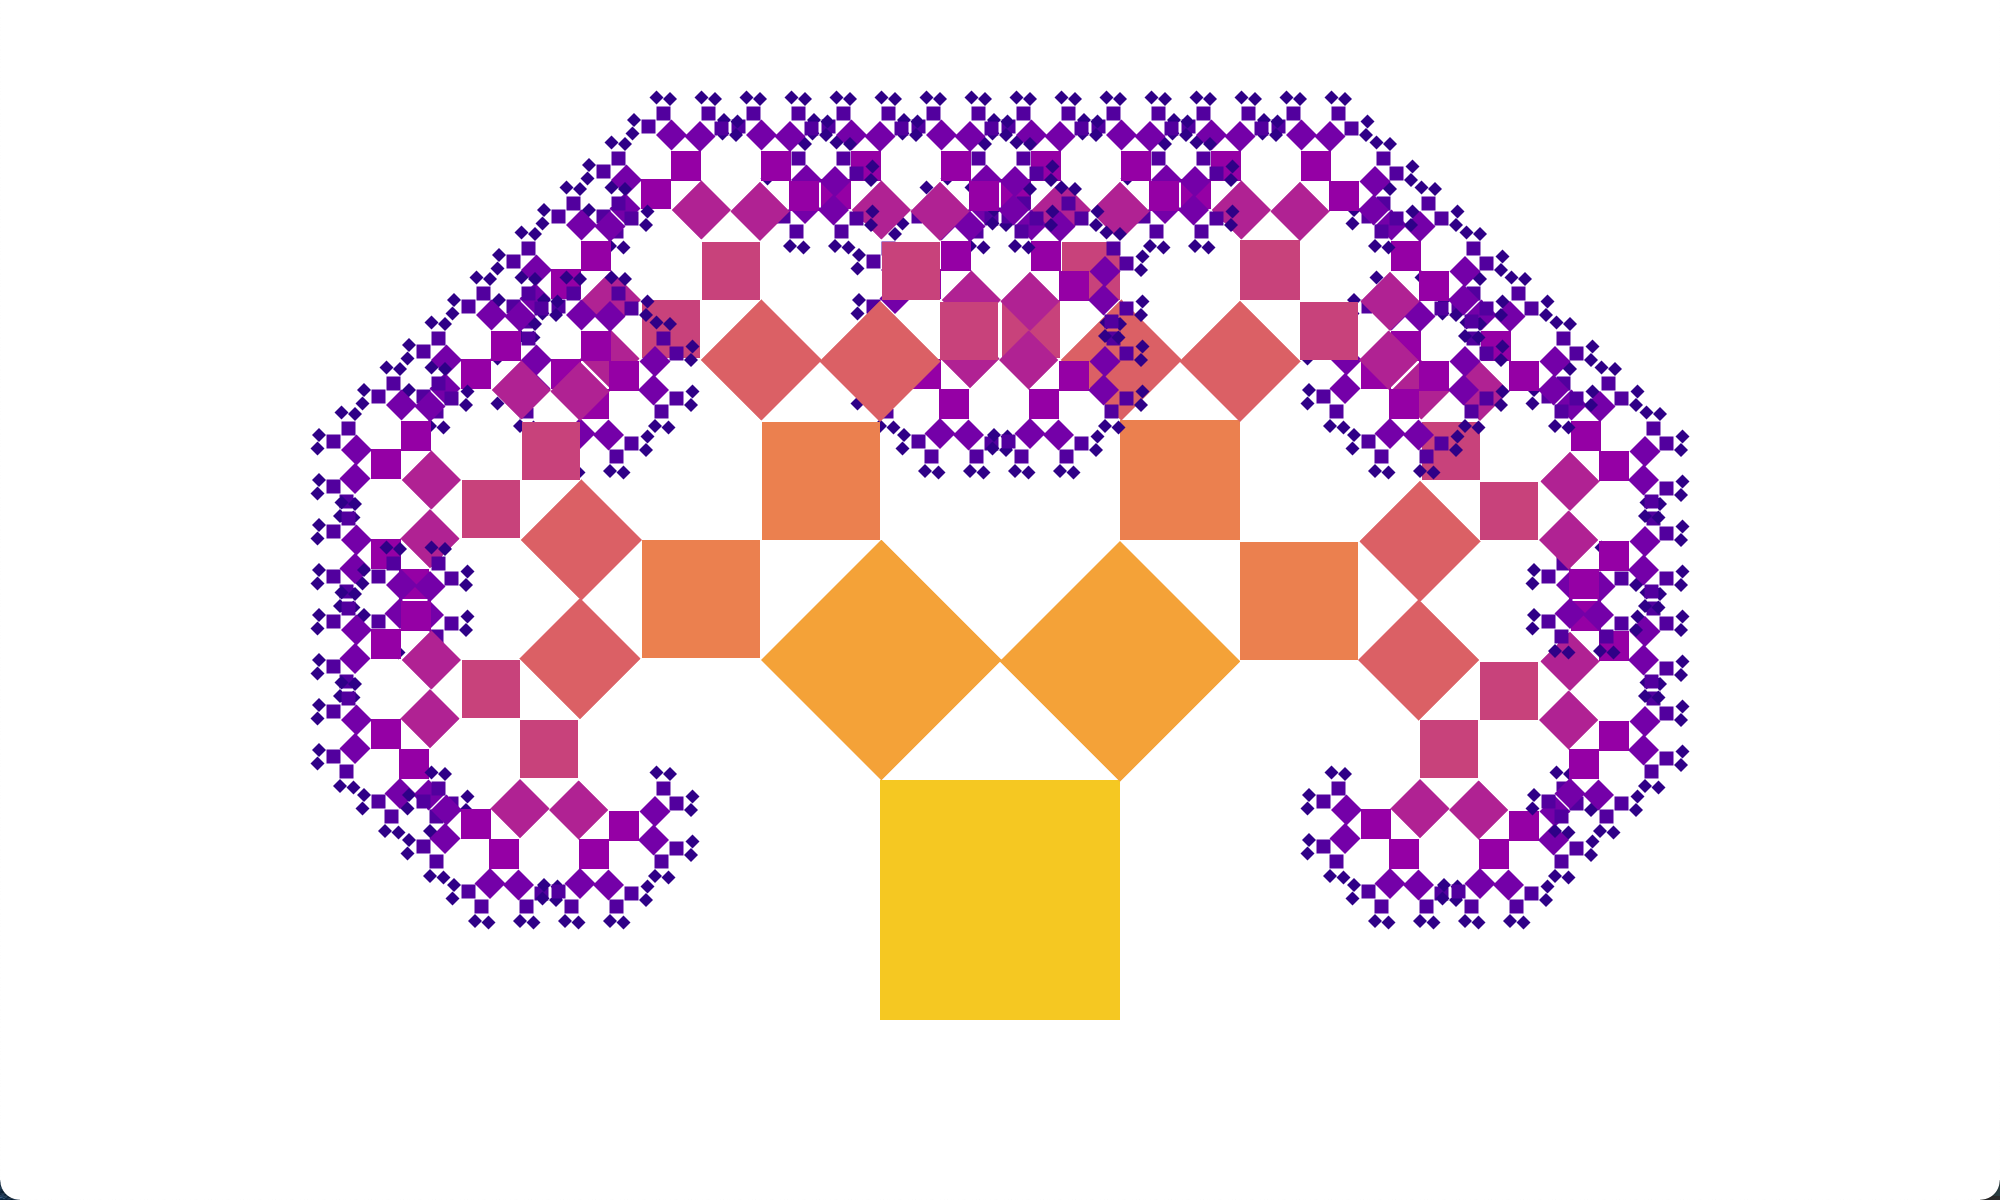
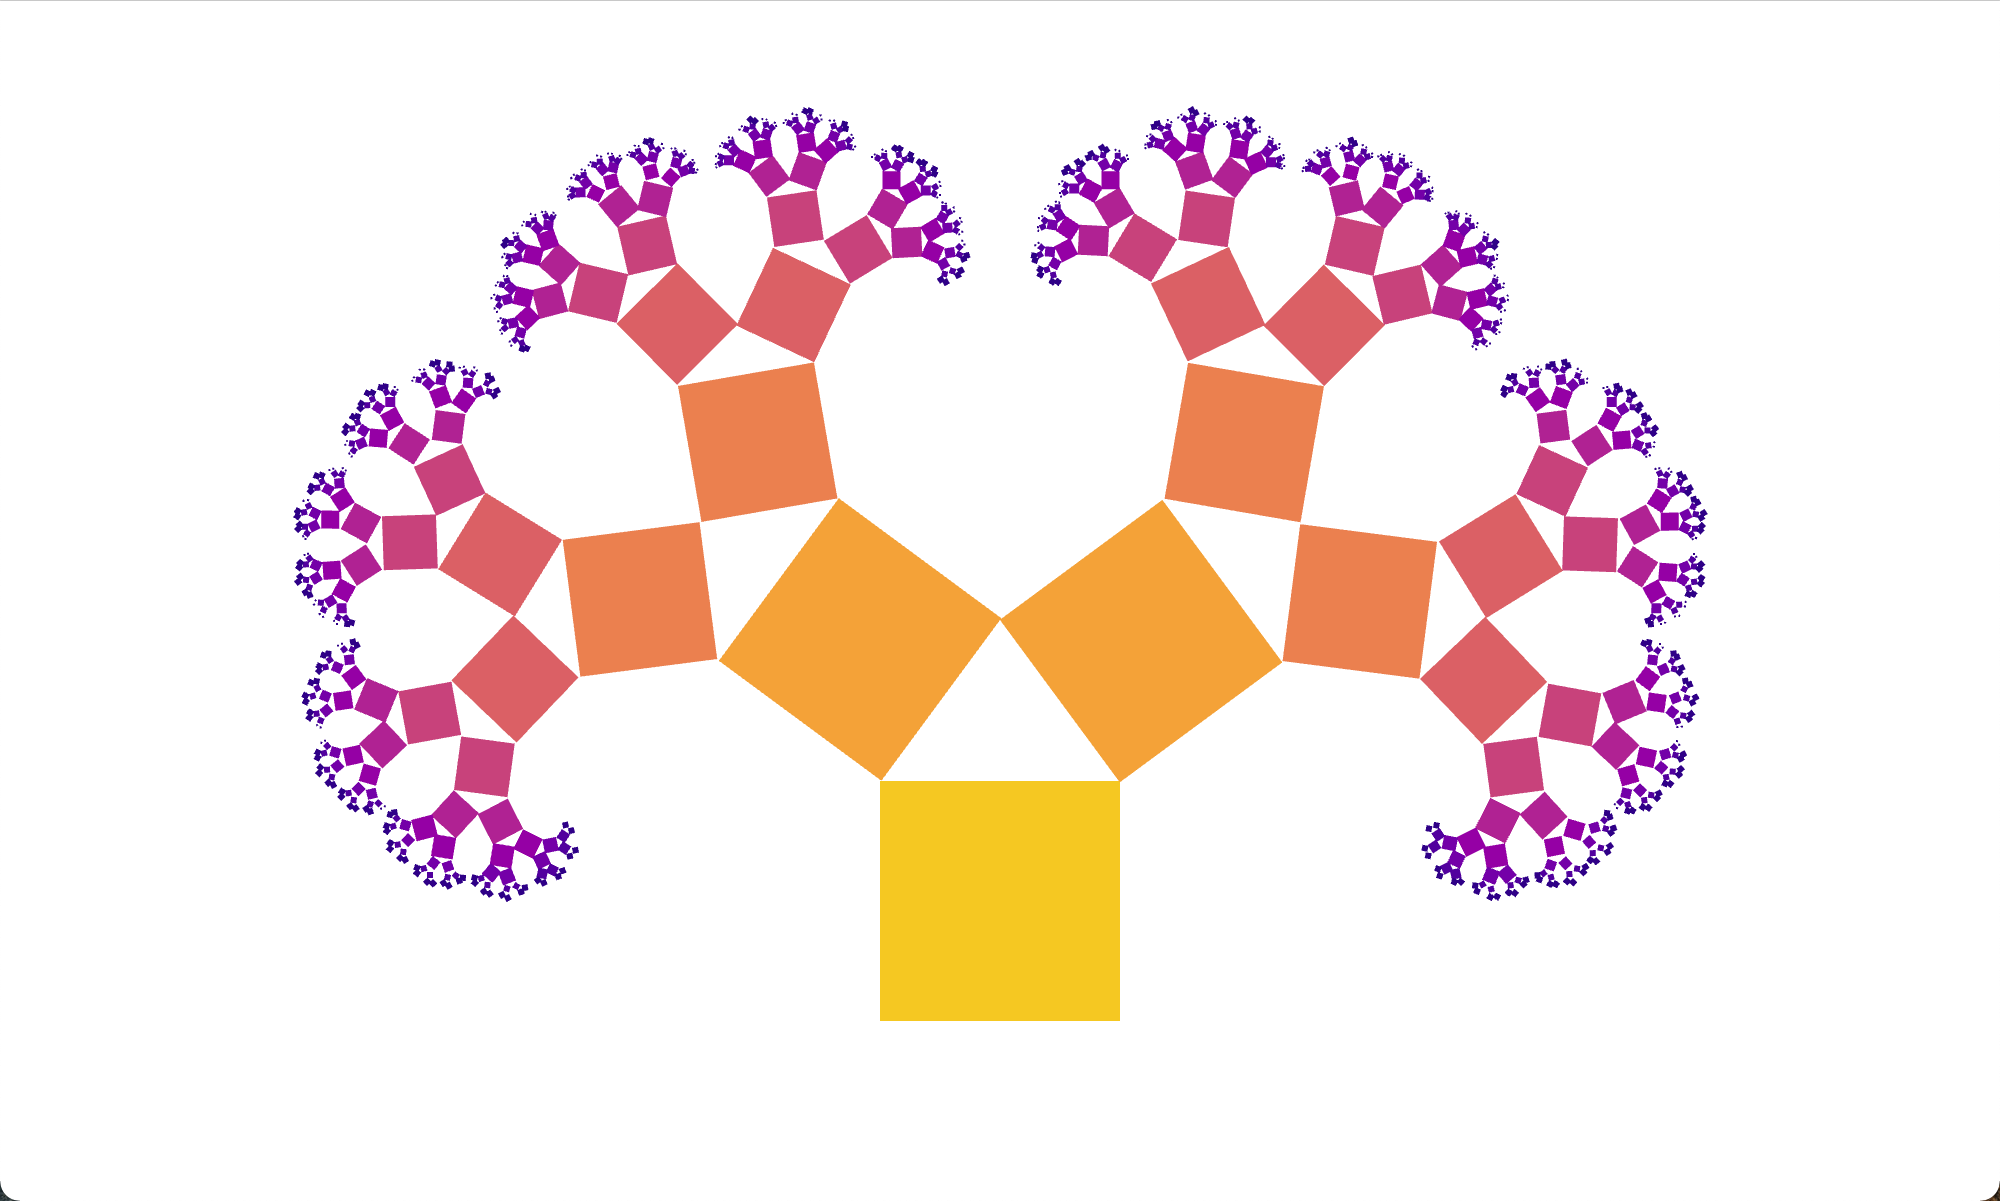
When I looked to see if anyone had worked on this problem, I was happy to find this paper, Overlap-Free Drawing of Generalized Pythagoras Trees for Hierarchy Visualization (2019), which describes an adapted drawing algorithm that iteratively modifies the size and angle of the squares to eliminate overlap. Even better, the authors' GitHub has the Python source code for making all the pretty trees that you see on this page. The pictures below show a symmetric binary Pythagoras fractal before and after the implementation of the algorithm:
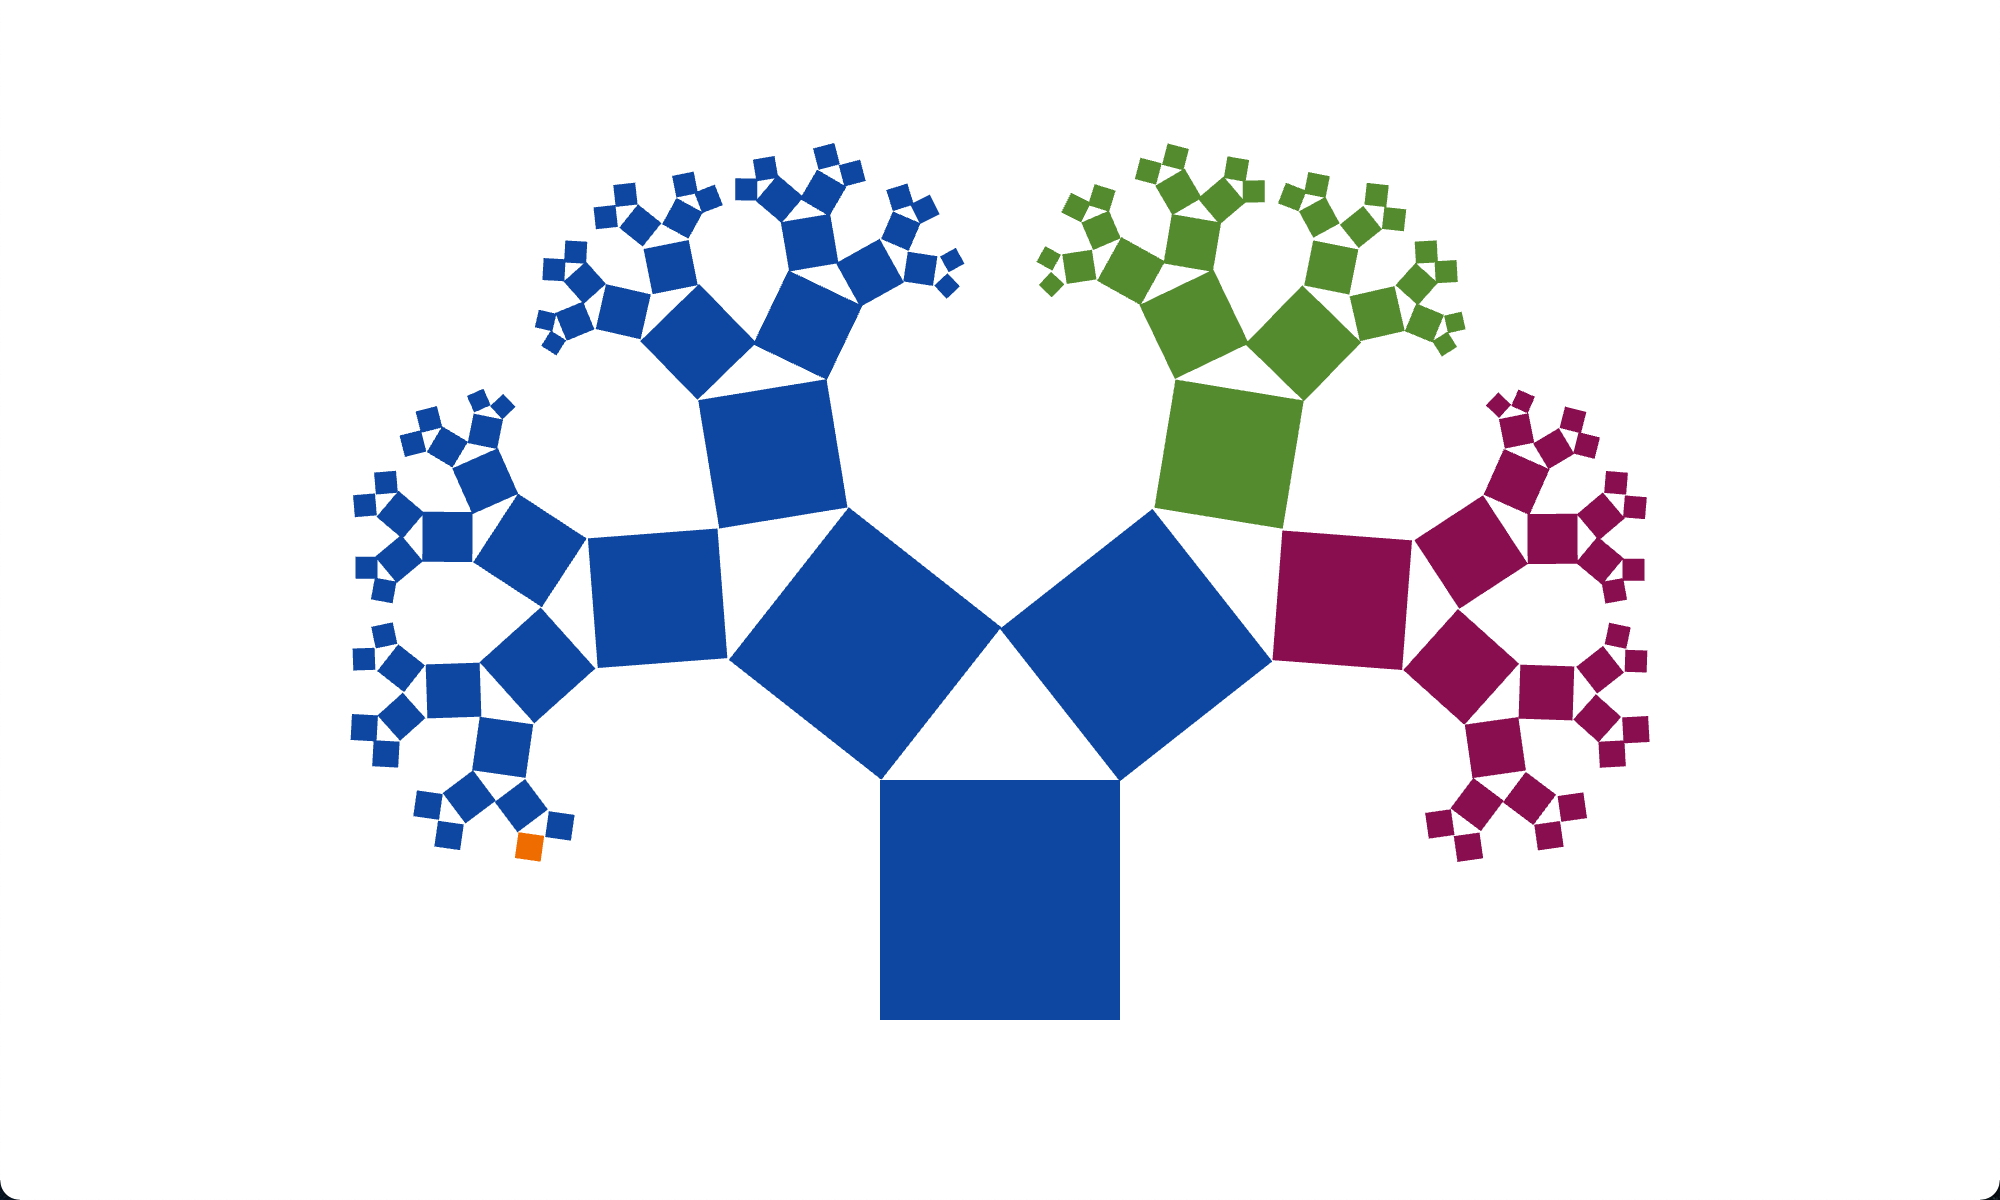
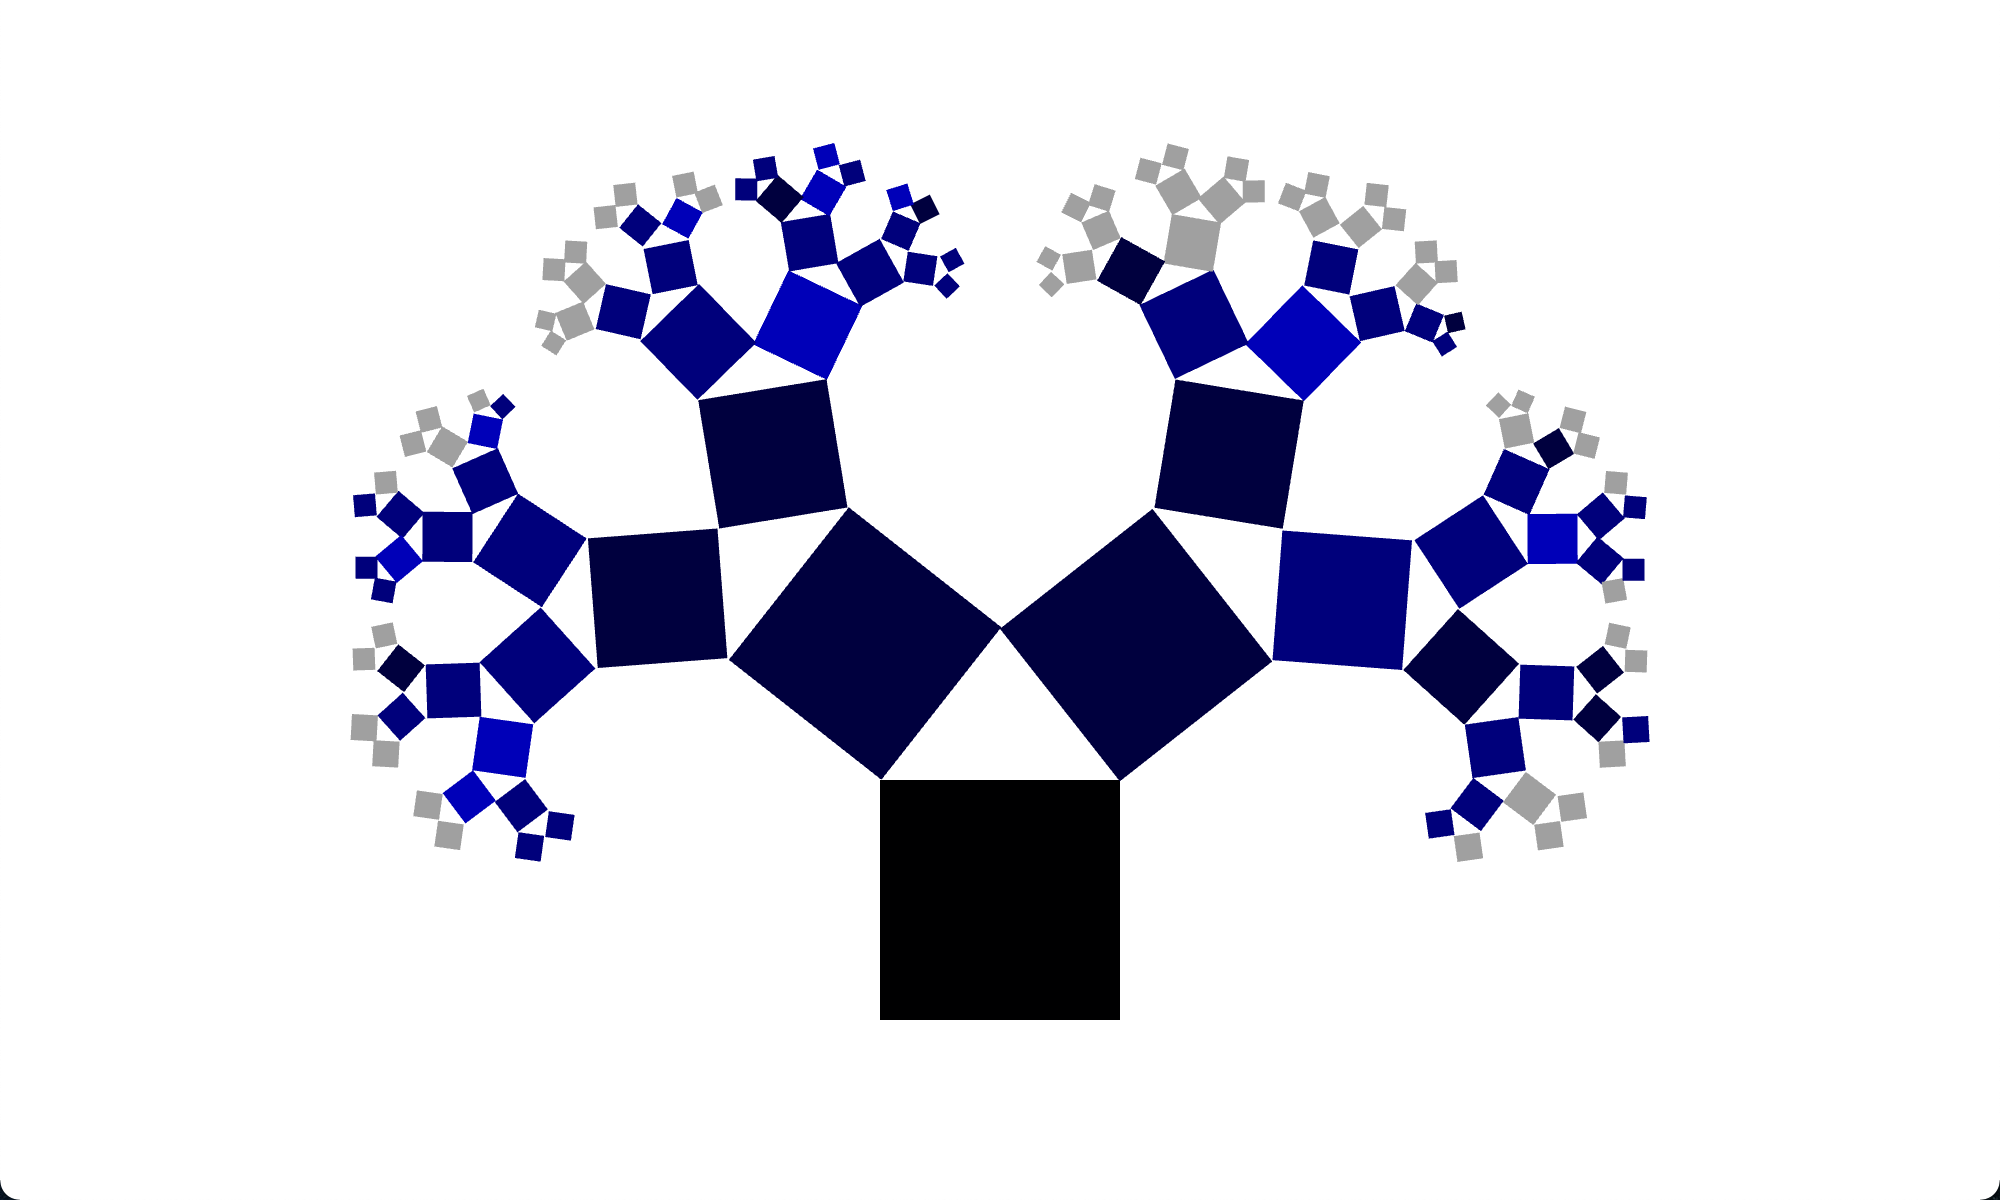
The first thing that occurred to me was that this would be an interesting way to depict geneological information. I made minimal modifications to the code to change the color of the squares based on variables, in this case information I have collected about the history of my family. In the three trees below, the biggest square represents me, the next branch represents my mother and father respectively, the next represents my four grandparents, and the smallest leaves represent each of my 64 great-great-great-great grandparents (most of whom were born in the late 1700s).
The tree on the left represents the probable first language of each of these individuals: Blue is English, Purple is German, Green is Czech, and Orange is Dutch. Individuals on my father's side maintained their heritage languages for multiple generations after immigrating to the United States.
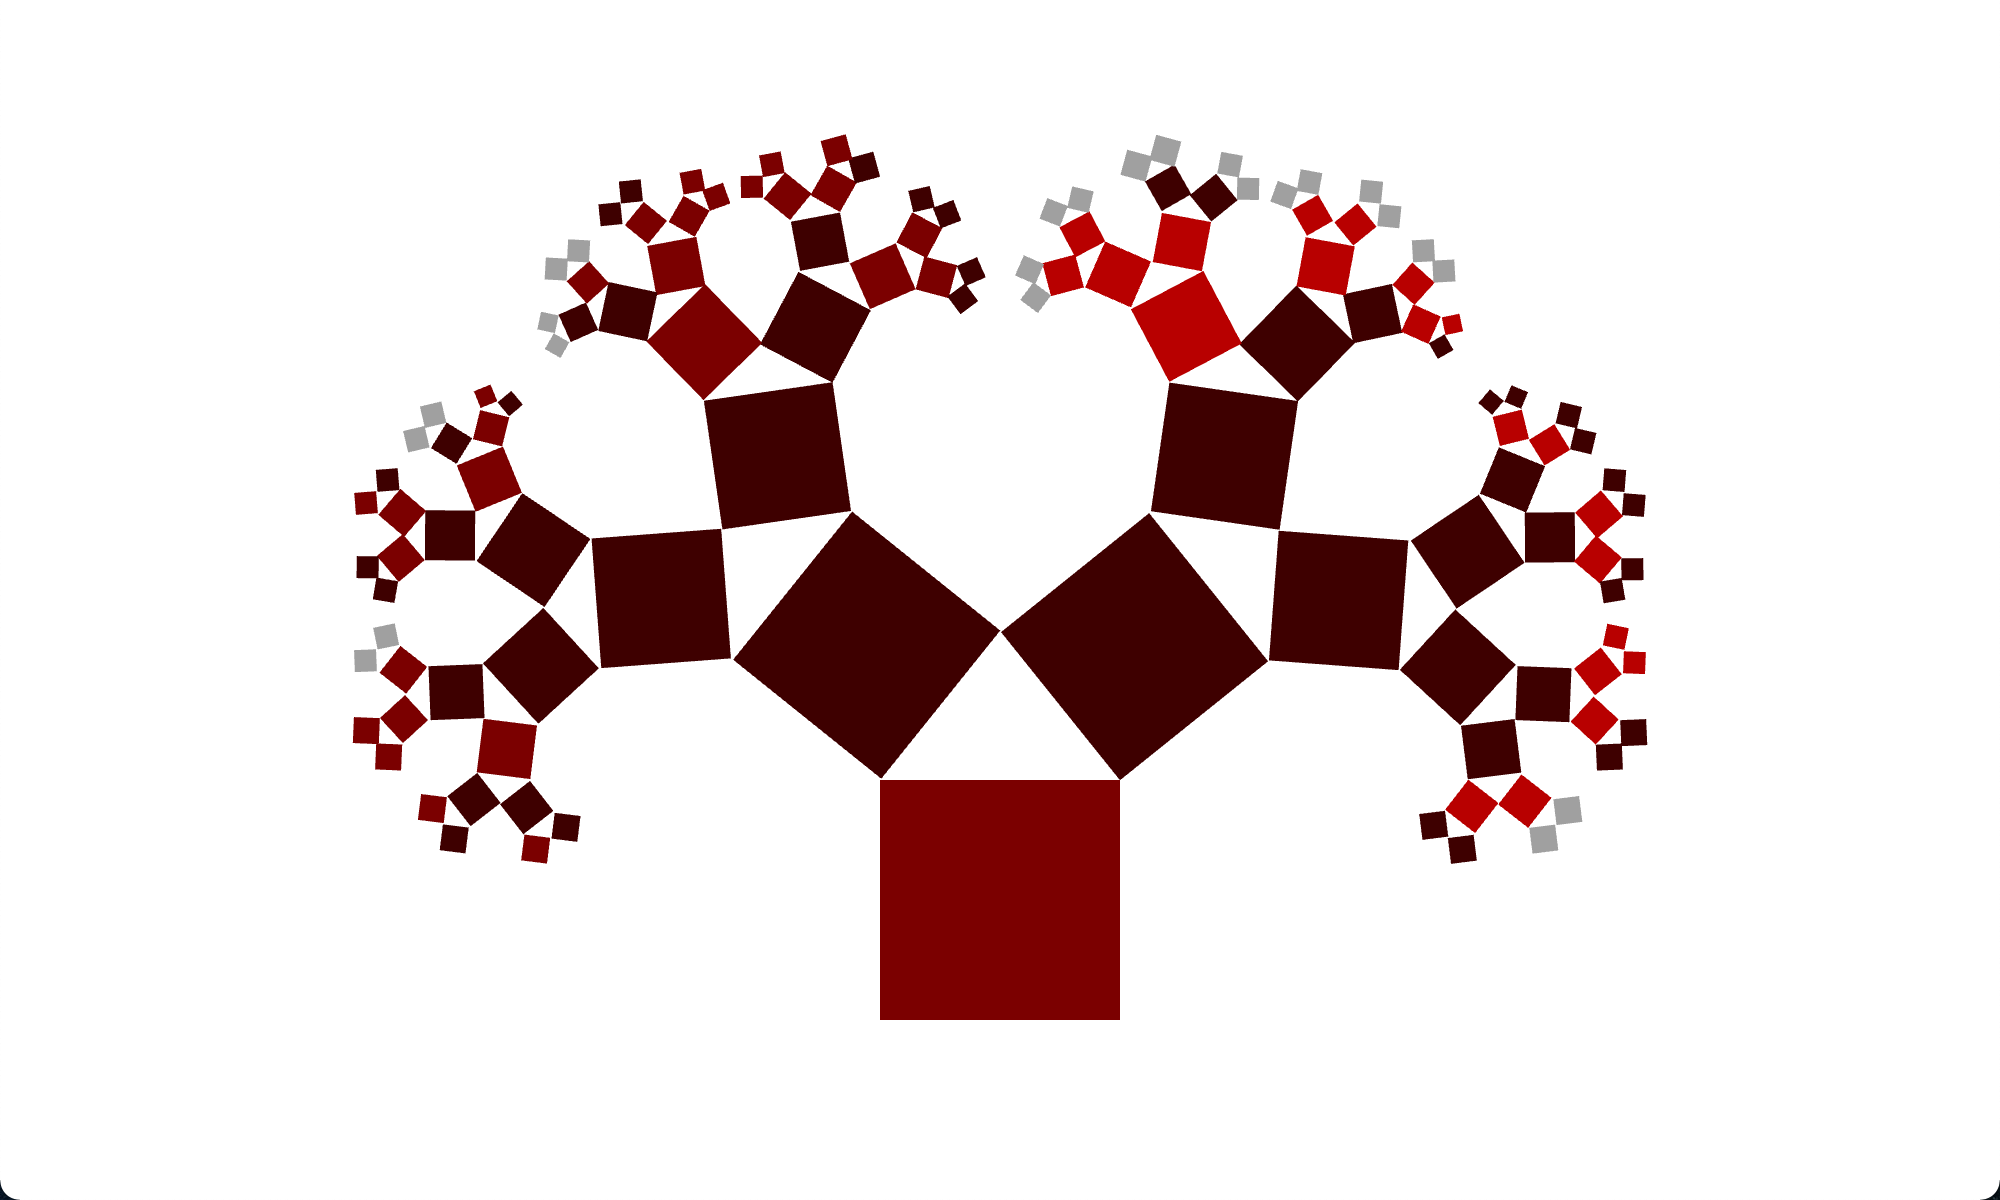
The tree in the middle depicts movement over an individual's lifetime: I calculated the distance from the known birth place and place of death (or current residence if still alive) for each individual. The dark red squares are individuals who moved less than 500 miles from their birth place. The medium red squares moved from 500-2000 miles, and the light red squares moved more than 5000 miles (I don't have any information for the grey squares).
I, my parents, my grandparents, and all but one great-grandparent were born in Texas. On my mother's side, the medium red squares represent historical migrations from Southern Atlantic states (mostly the Carolinas) to Texas in the mid-19th century, sometimes with a generational stopover in Tennessee, Kentucky, or Alabama. On my father's side, the bright red squares represent slightly later migrations from Central Europe (mostly Saxony and Bohemia) to Texas in the mid-to-late 19th-century.
The tree on the right is a rough illustration of family size. It is a count of the number of known siblings for each individual (although I lacked records for many of the earliest generations). The darkest blue, found only on the square representing myself, represents an individual with no siblings. The next lightest blue represents individuals with 1-4 siblings, and is found mostly in the second and third generations. The next lightest blue represents individuals with 4-10 siblings, and the lightest blue represents individuals with 10-16 siblings.
The second thing that occurred to me was that Pythagoras trees could depict typographical information on a linguistic family tree model. The branches on these trees are much more complex, because they are non-binary (a language family may branch into three or more sub-families). For these trees, the size of the square is made to be proportional to the number of daughters it has, so a branch that contains many different languages and dialects will be proportionally larger than one that contains fewer.
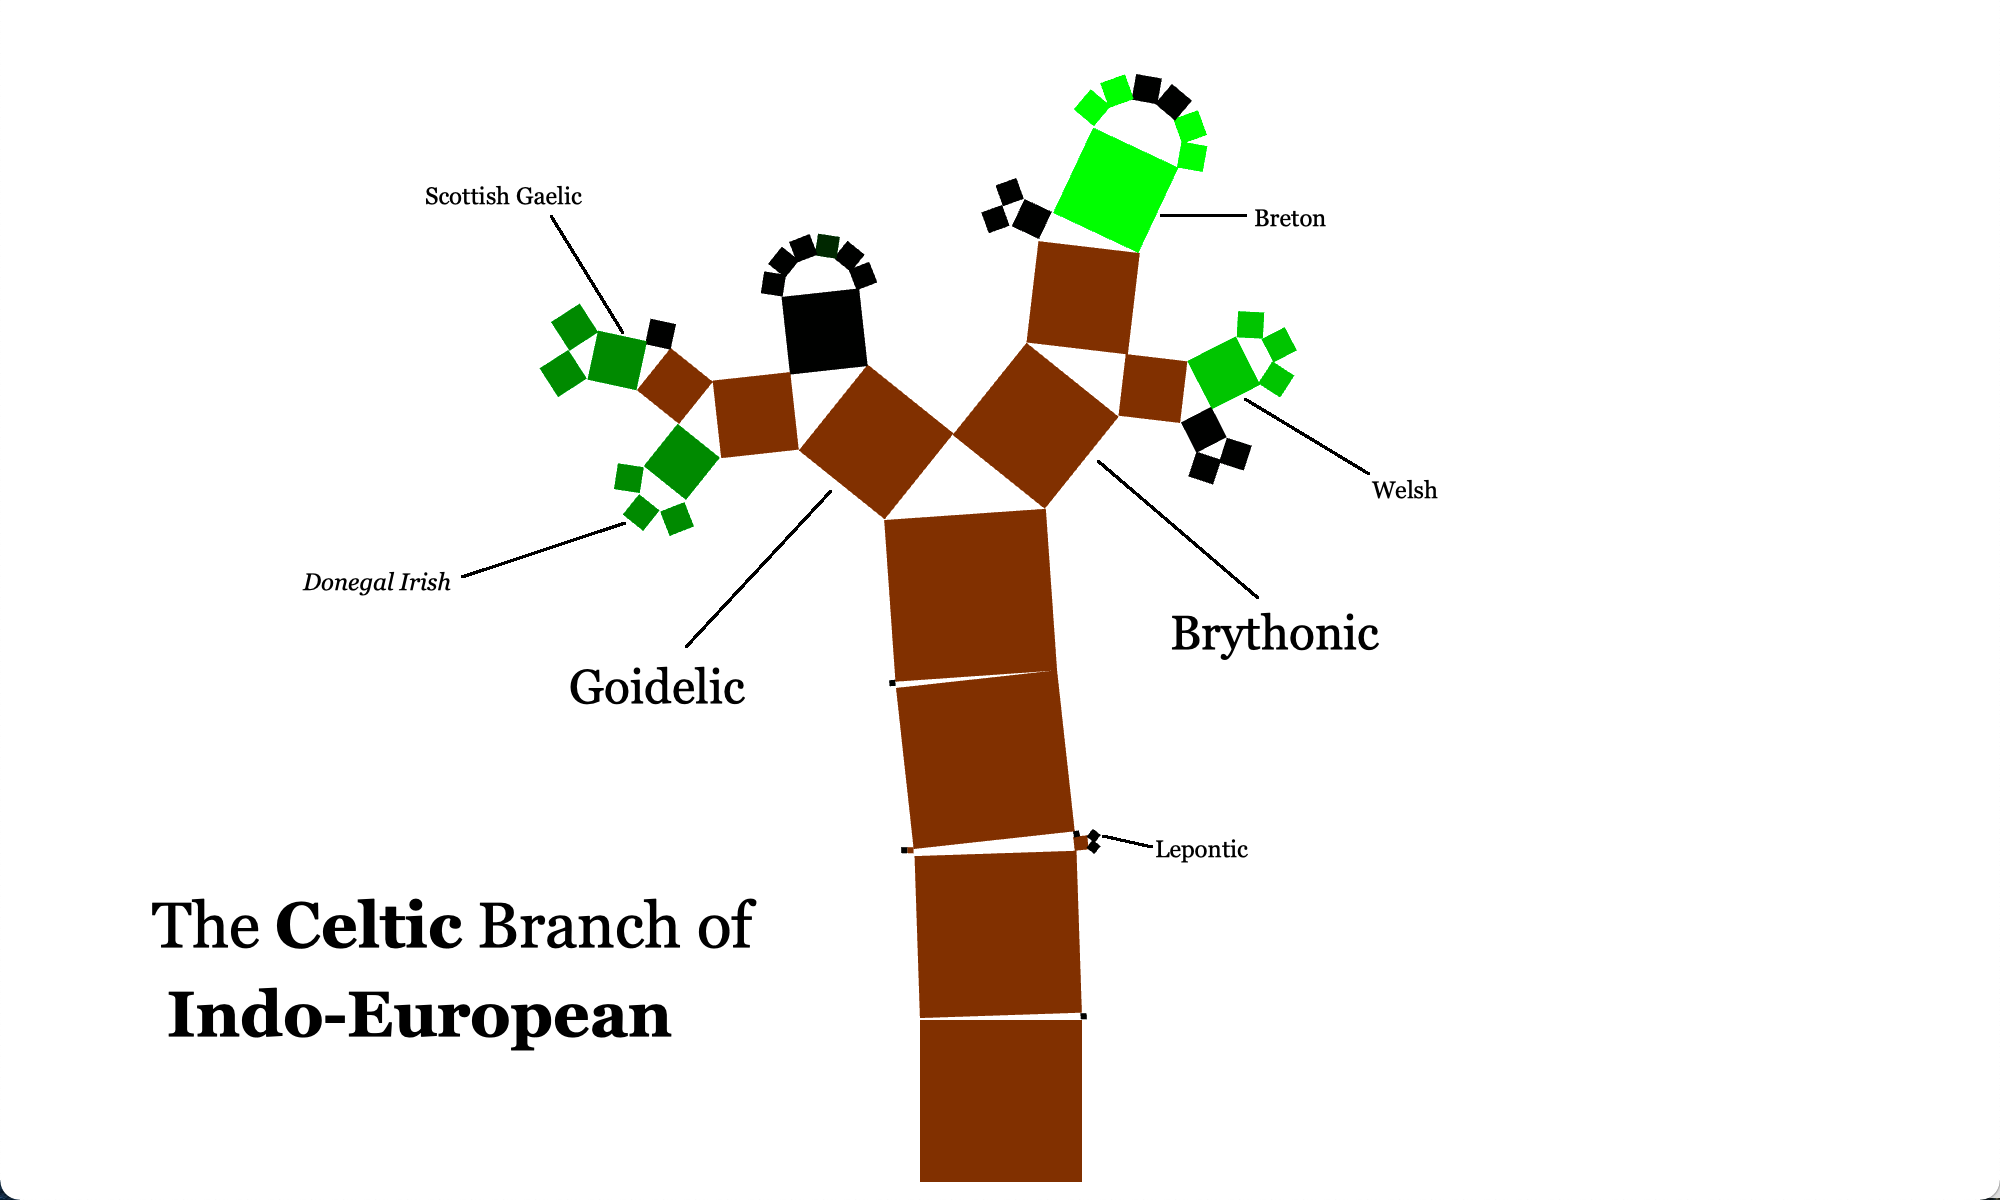
For these trees, I downloaded the language hierarchy data (in Newick format) from Glottolog. This is the Celtic branch of the Indo-European family:
For an illustration, I've labelled just a few of the sub-families, languages, and dialects. The brown squares are sub-families (e.g. Goidelic, Brythonic, Insular Celtic), while the black and green squares are languages and dialects. The color represents their level of endangerment according to Glottolog's Agglomerated Endangerment Scale, with each level of the scale along a range from black to bright green: Extinct, Nearly Extinct, Moribund, Shifting, Threatened, and Not Endangered. I considered dialects of a language to have the same status as the language itself, except when the dialect status is specifically stated. Above, Breton is the only Celtic language that is considered not to be endangered, while Welsh is classified as Threatened and Scottish Gaelic as Shifting.
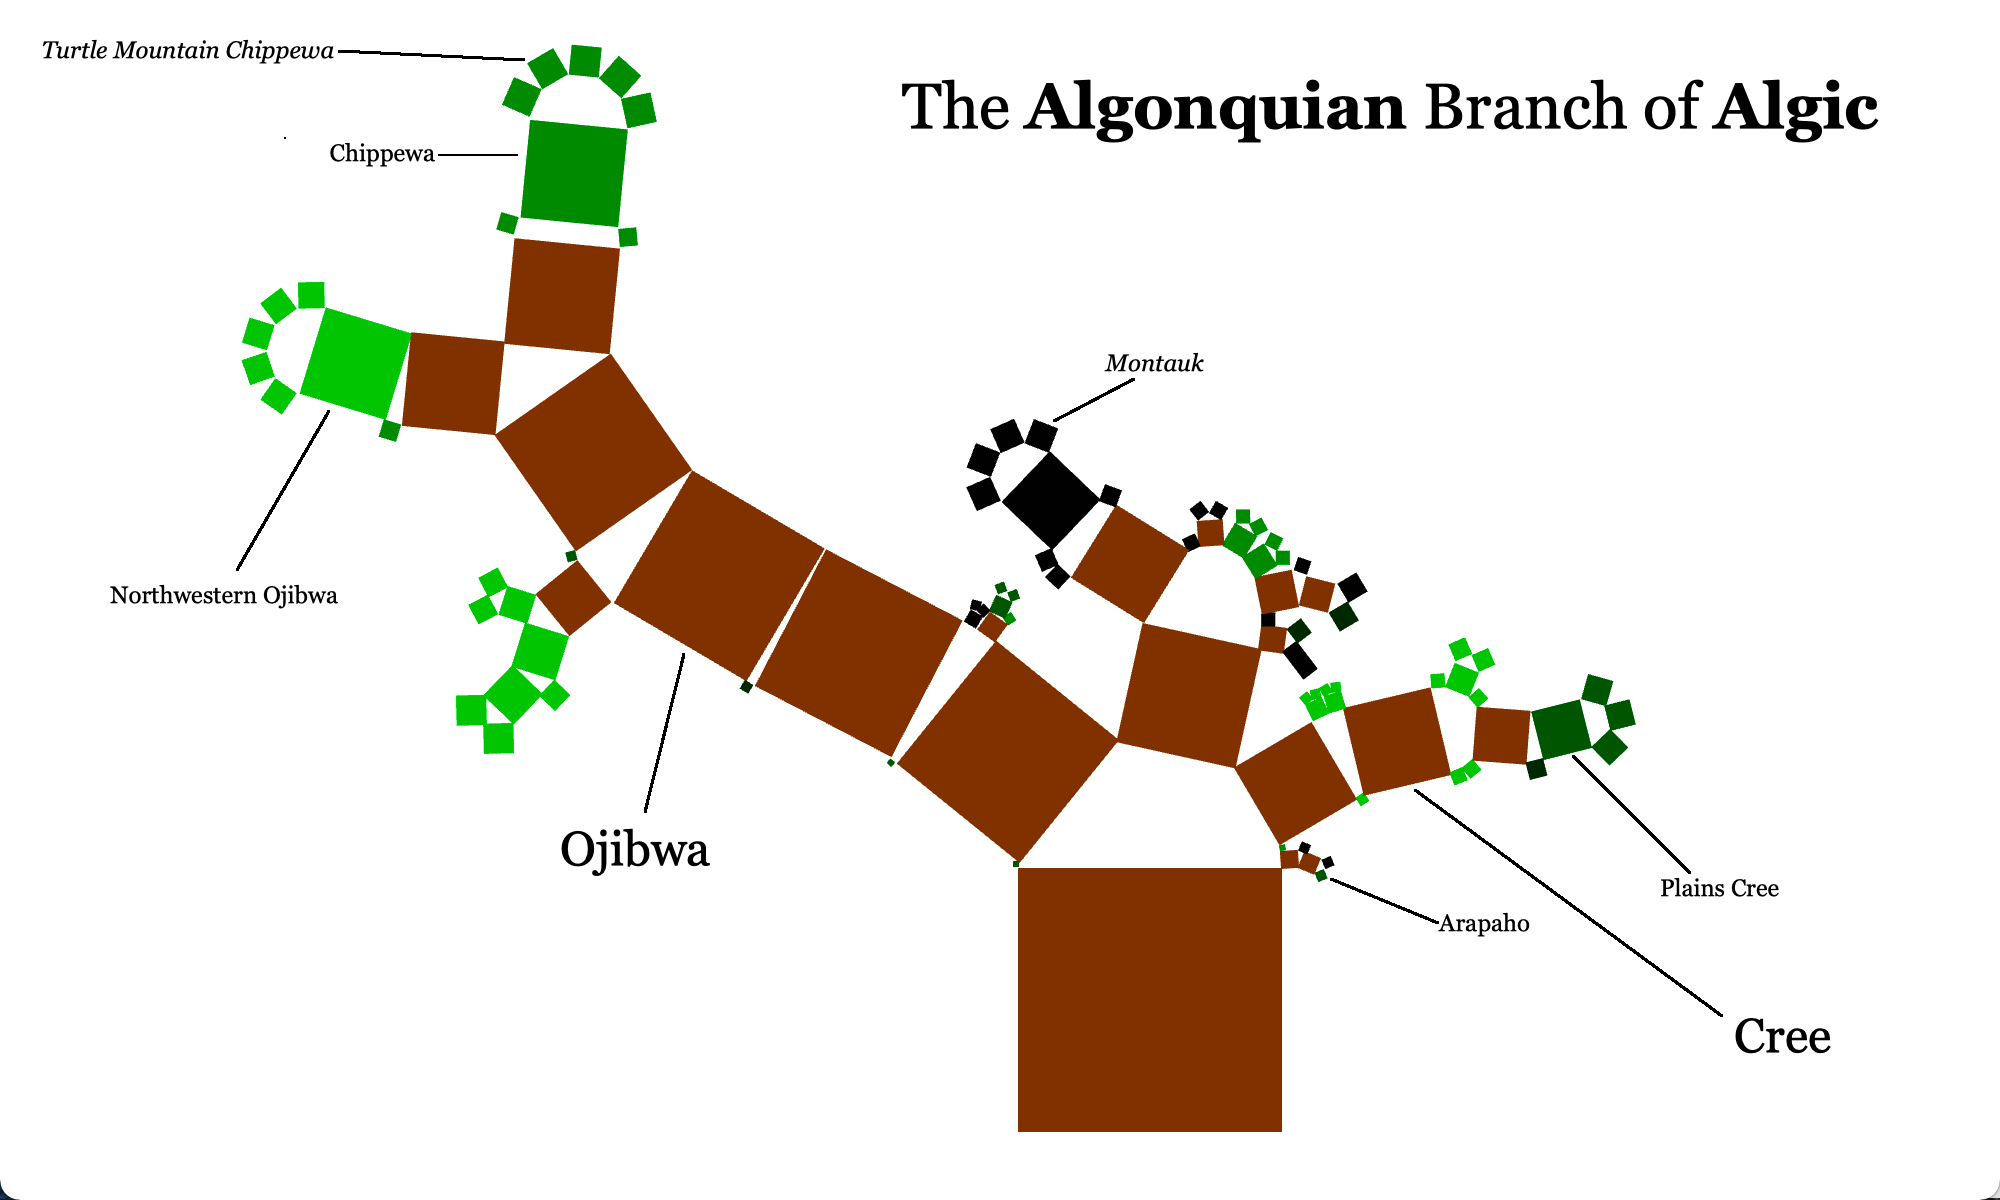
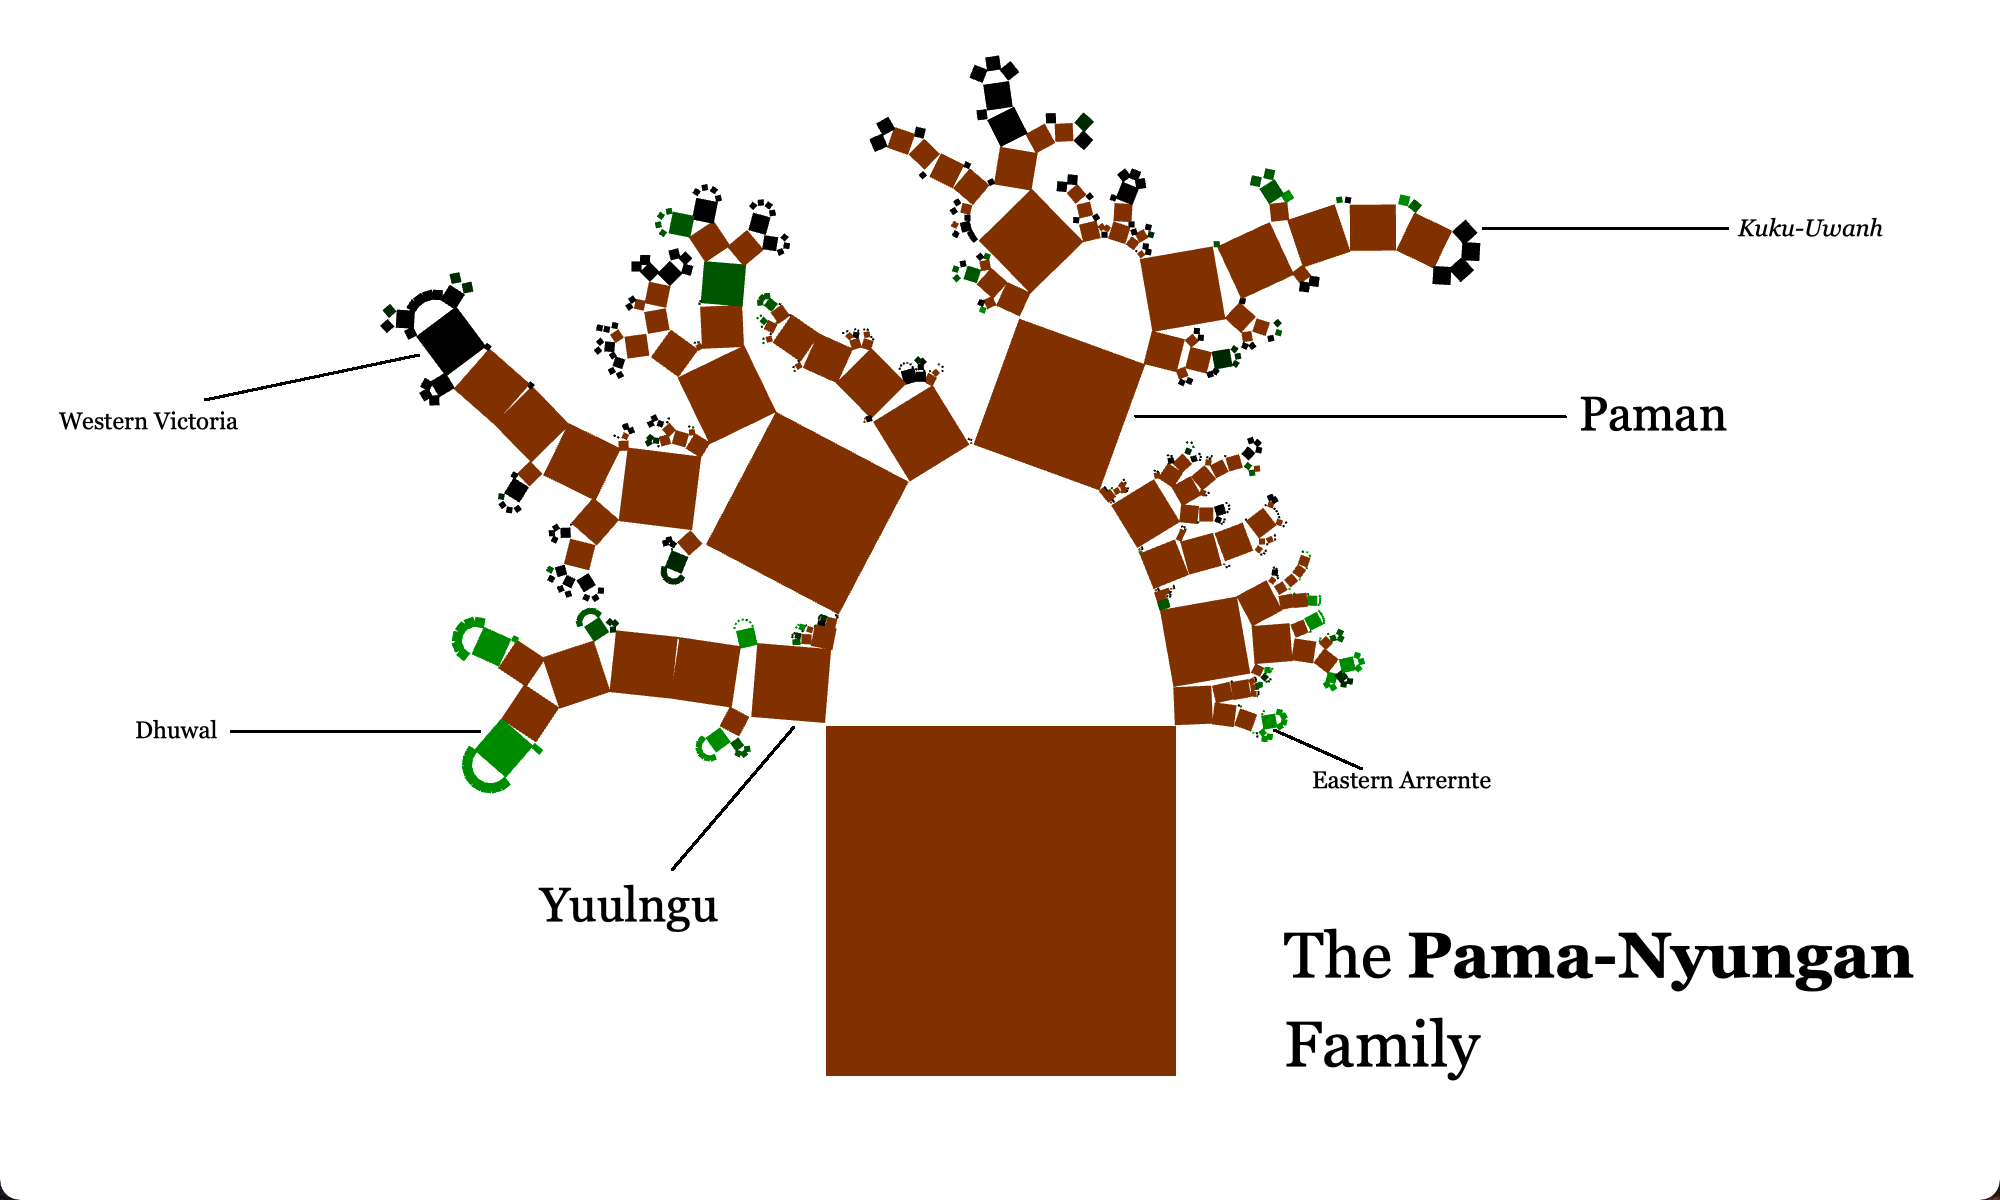
Below I made trees for two other language families: The Algonquian branch of Algic, which consists of languages spoken in the United States and Canada, and the entire Pama-Nyungan family tree, which consists of languages spoken in Australia. The Pama-Nyungan tree contains 624 sub-families, languages, and dialects. Of these languages and dialects, more than half are extinct, two-thirds are either extinct or nearly extinct, and all are at least threatened.
Hammarström, Harald & Forkel, Robert & Haspelmath, Martin & Bank, Sebastian. 2021. Glottolog 4.4. Leipzig: Max Planck Institute for Evolutionary Anthropology. https://doi.org/10.5281/zenodo.4761960. (Available online at http://glottolog.org, Accessed on 2021-07-26.)